Last updated on
VM Monitoring
The Giám sát (Monitor) tab on each VM provides real-time charts of resource usage — to catch overload, bottlenecks or anomalies early.
Metrics
| Metric | Meaning |
|---|---|
| CPU usage | % of CPU used over the total vCPU allocated |
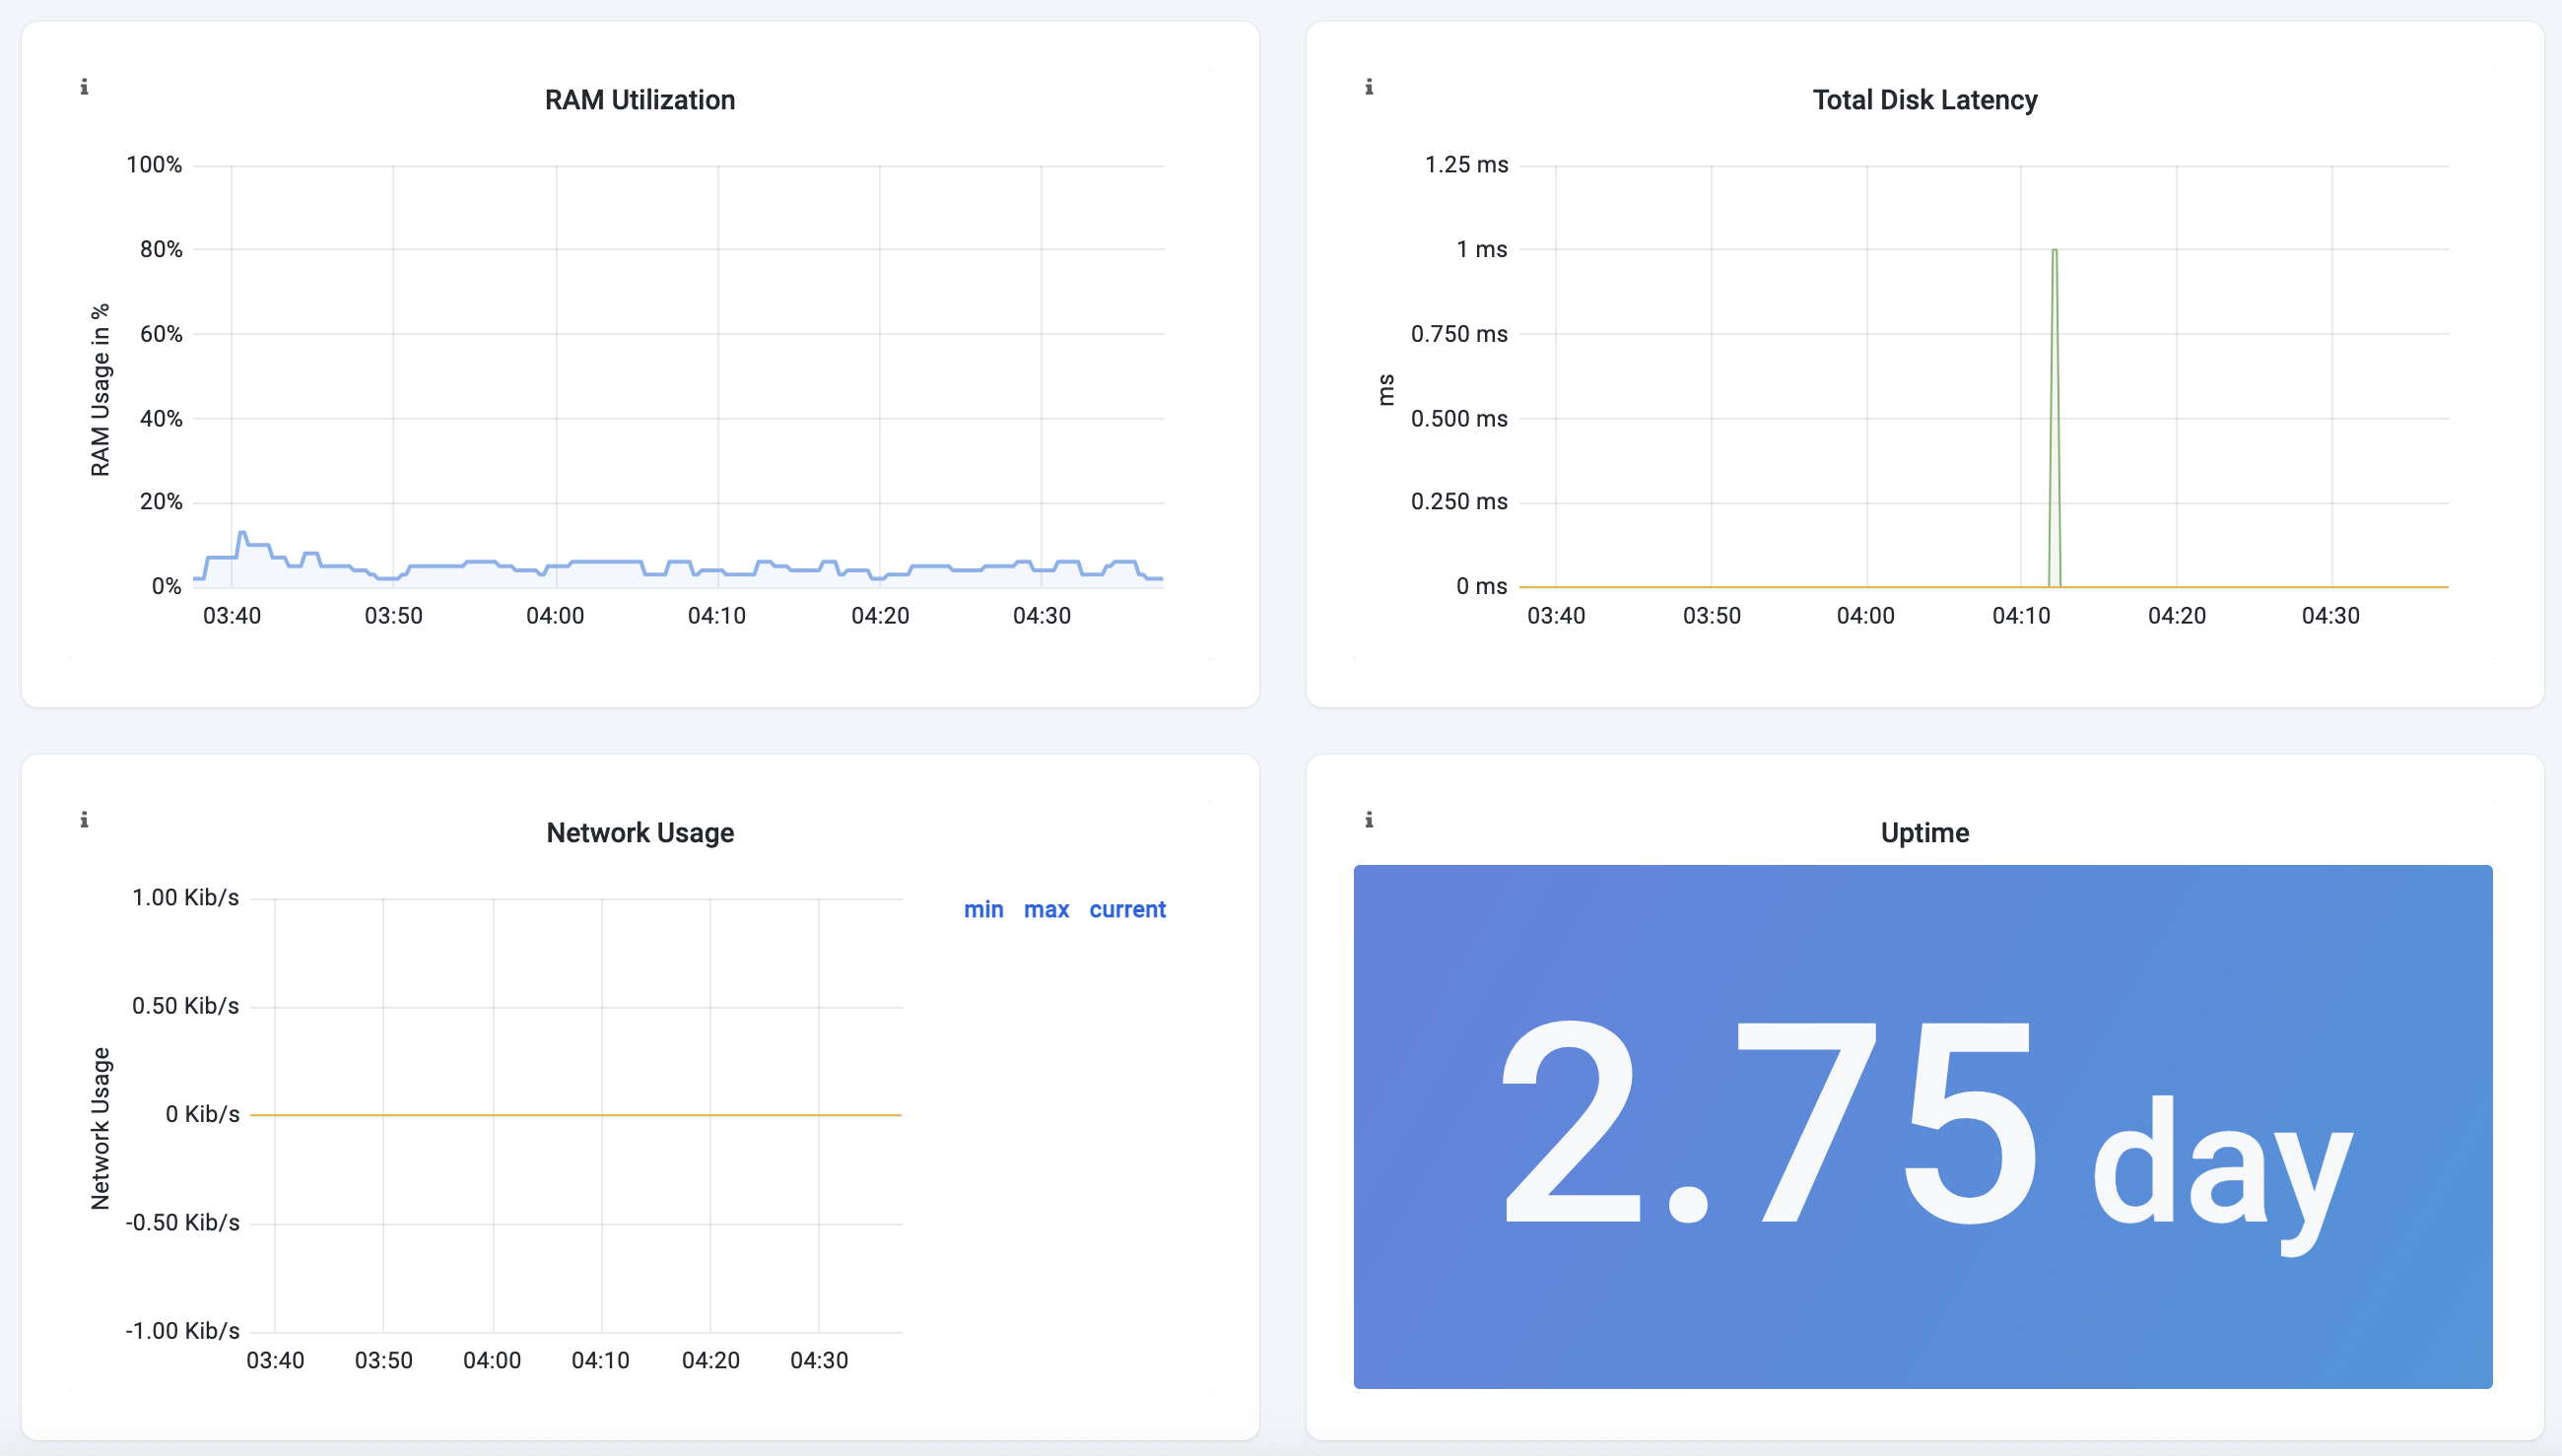
| RAM usage | % of memory in use |
| Disk I/O | Read/write throughput of the system volume |
| Network | In/out traffic across the Network Interfaces |
Open the monitoring tab
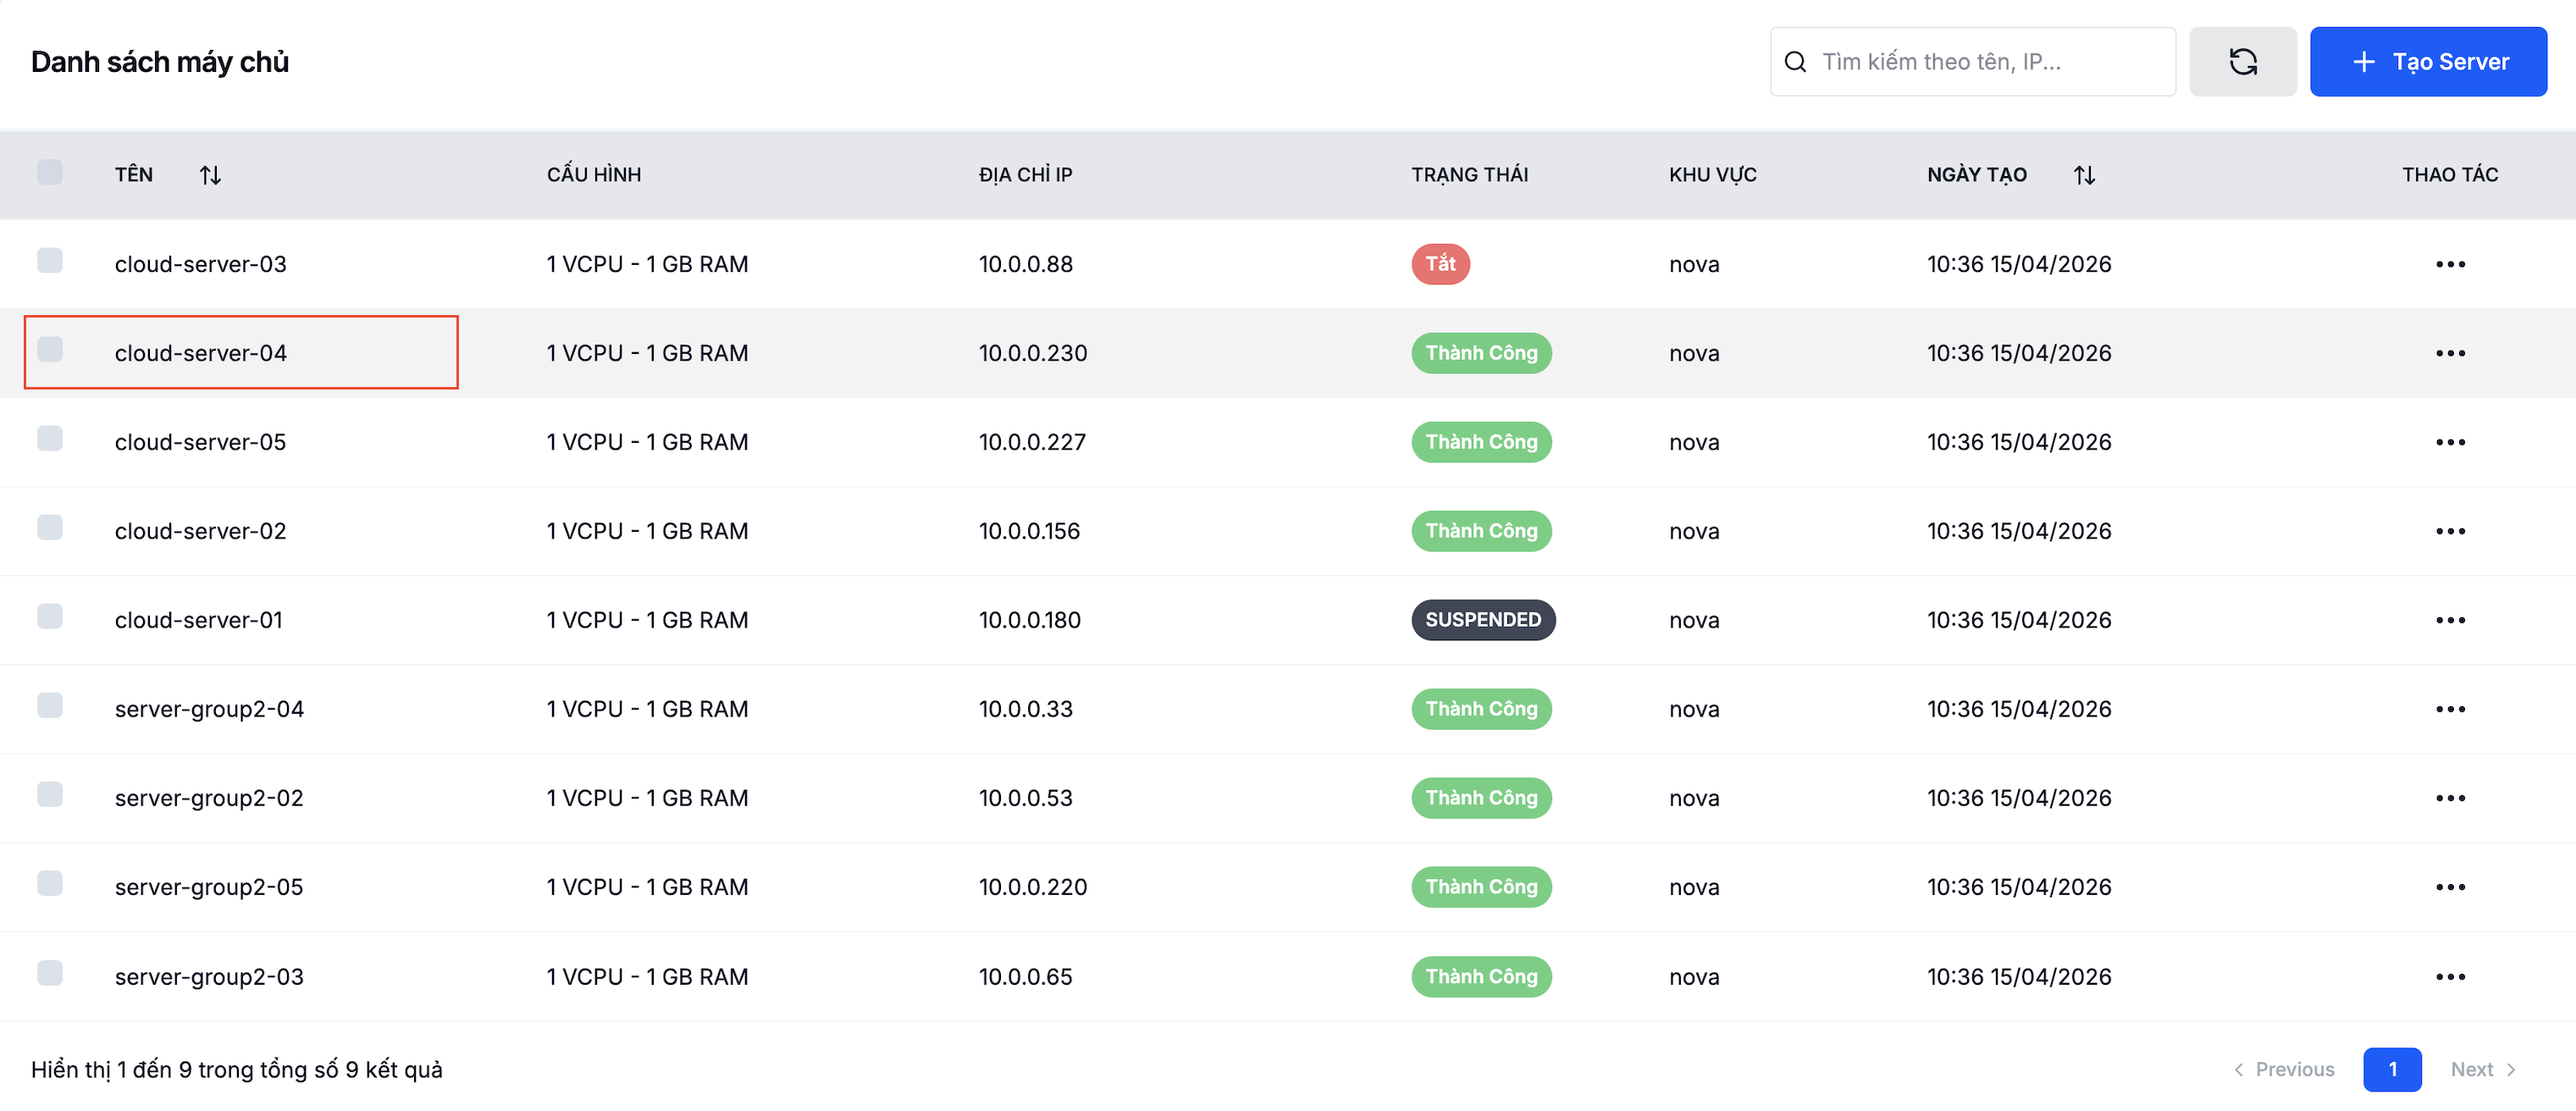
Step 1. Open the VM detail page
Go to Cloud Server → Servers and click the VM.
Step 2. Select the Giám sát tab
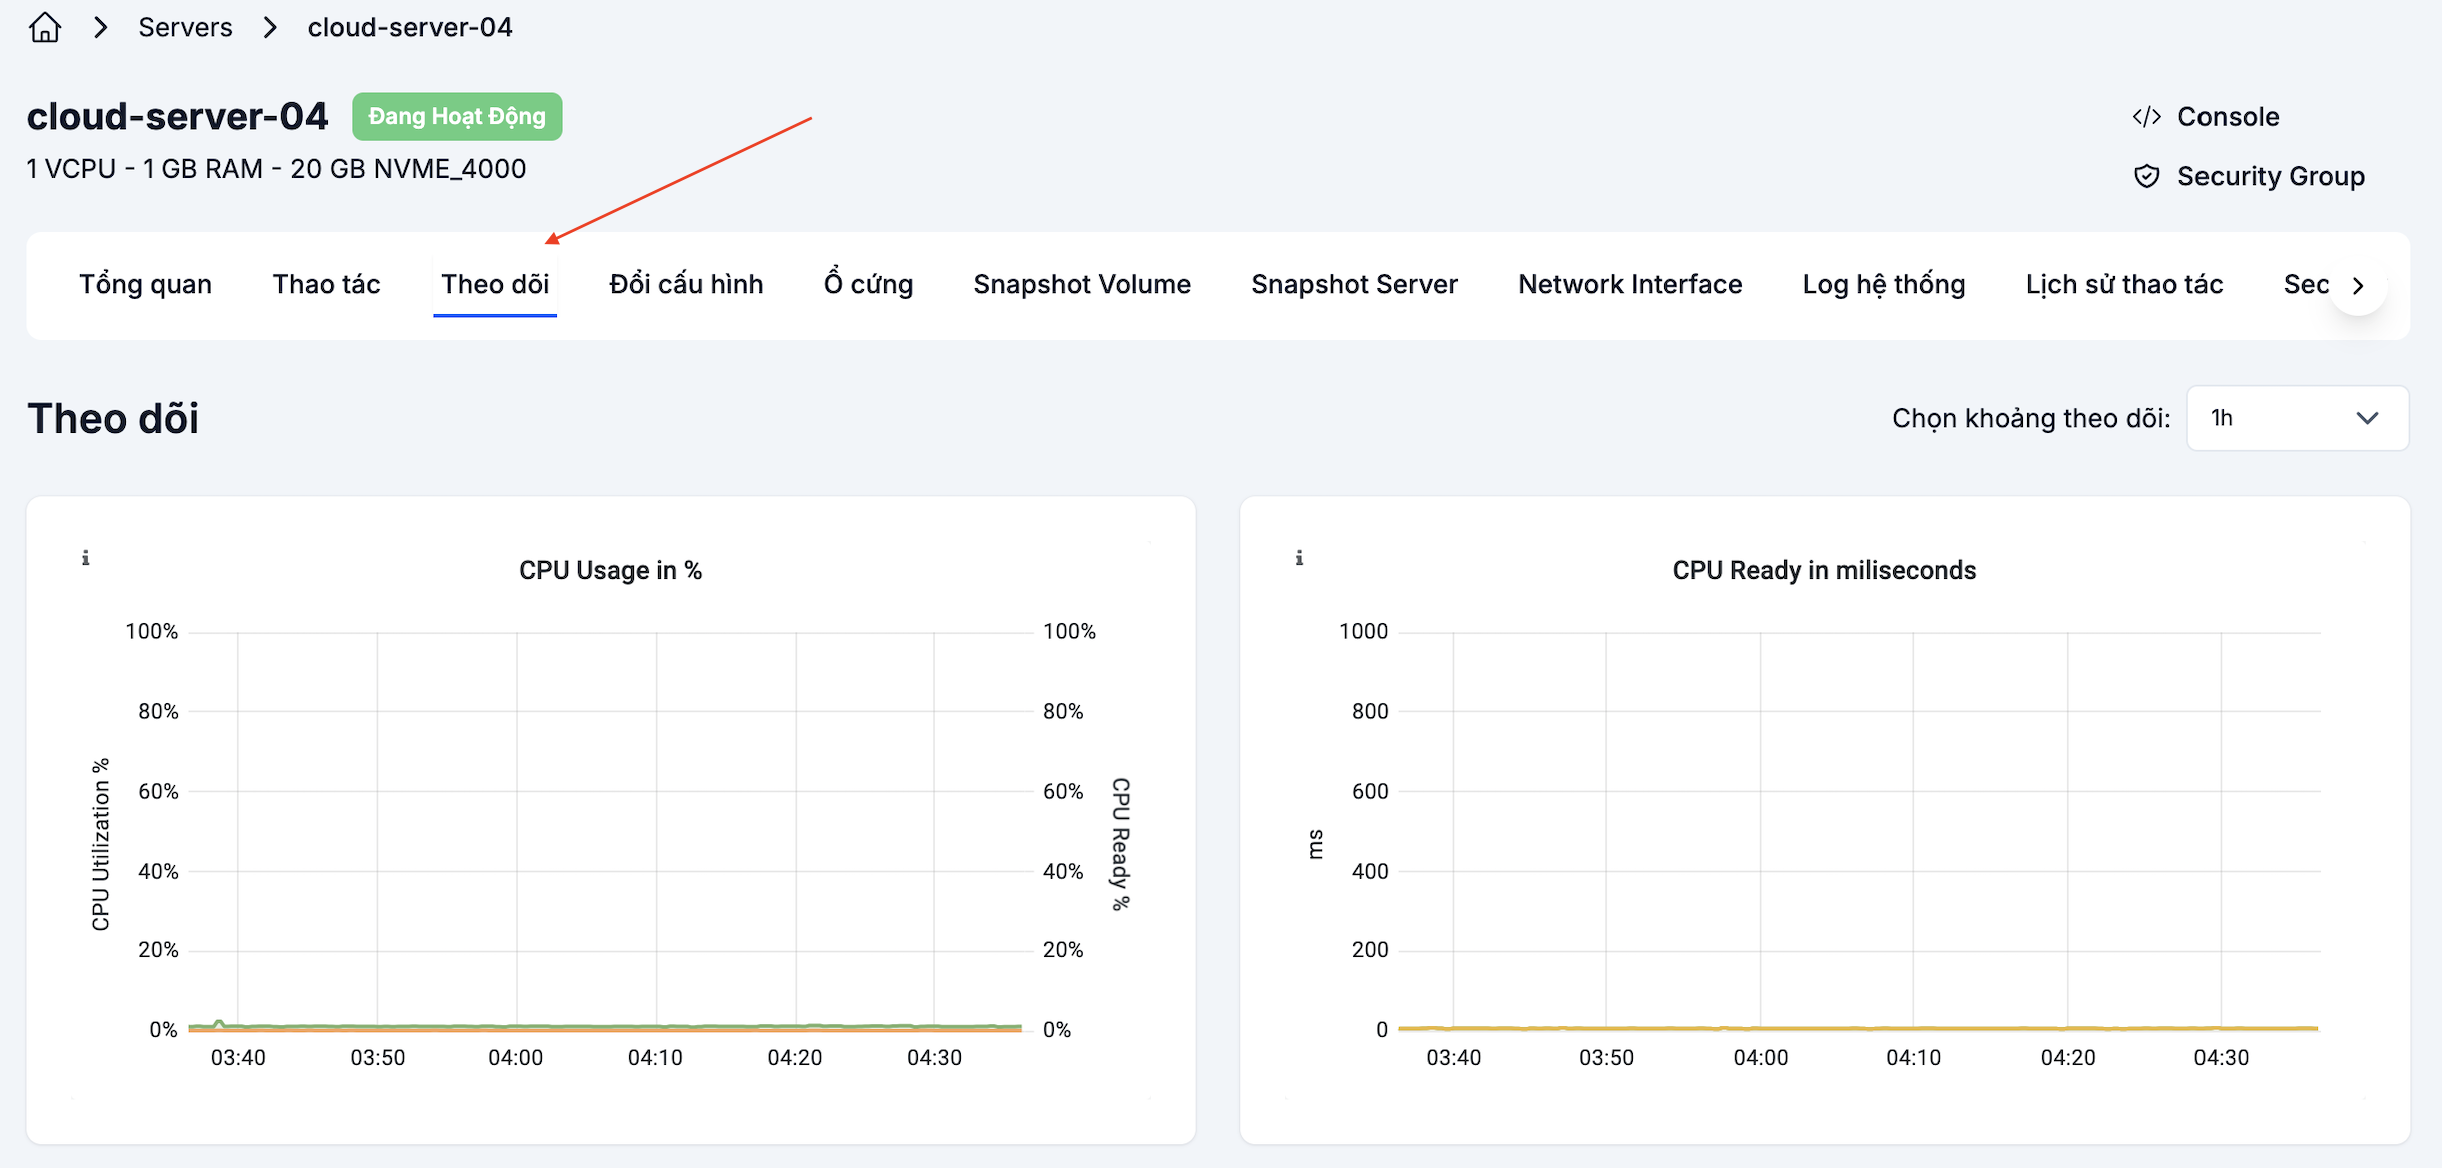
Step 3. Read the charts and change the time range
The charts plot each metric over time. Change the time range (1 hour, 6 hours, 24 hours, 7 days…) to analyse long-term trends or recent anomalies.
Reading the charts
- Short spikes (a few minutes) — usually periodic tasks (backup, cron job). Nothing to worry about.
- Sustained high (> 80% for hours) — resources nearly capped, time to upgrade the configuration.
- Gradual climb over time — could be a memory leak or natural traffic growth. Check application logs.
When CPU or RAM frequently sit above 80%, consider:
- Scale-up: upsize the existing VM.
- Scale-out: add another VM behind a Load Balancer and split the traffic.
Log and history tabs on the detail page
Beyond the Giám sát tab (resource charts), the VM detail page has two side tabs that help with debugging and audit:
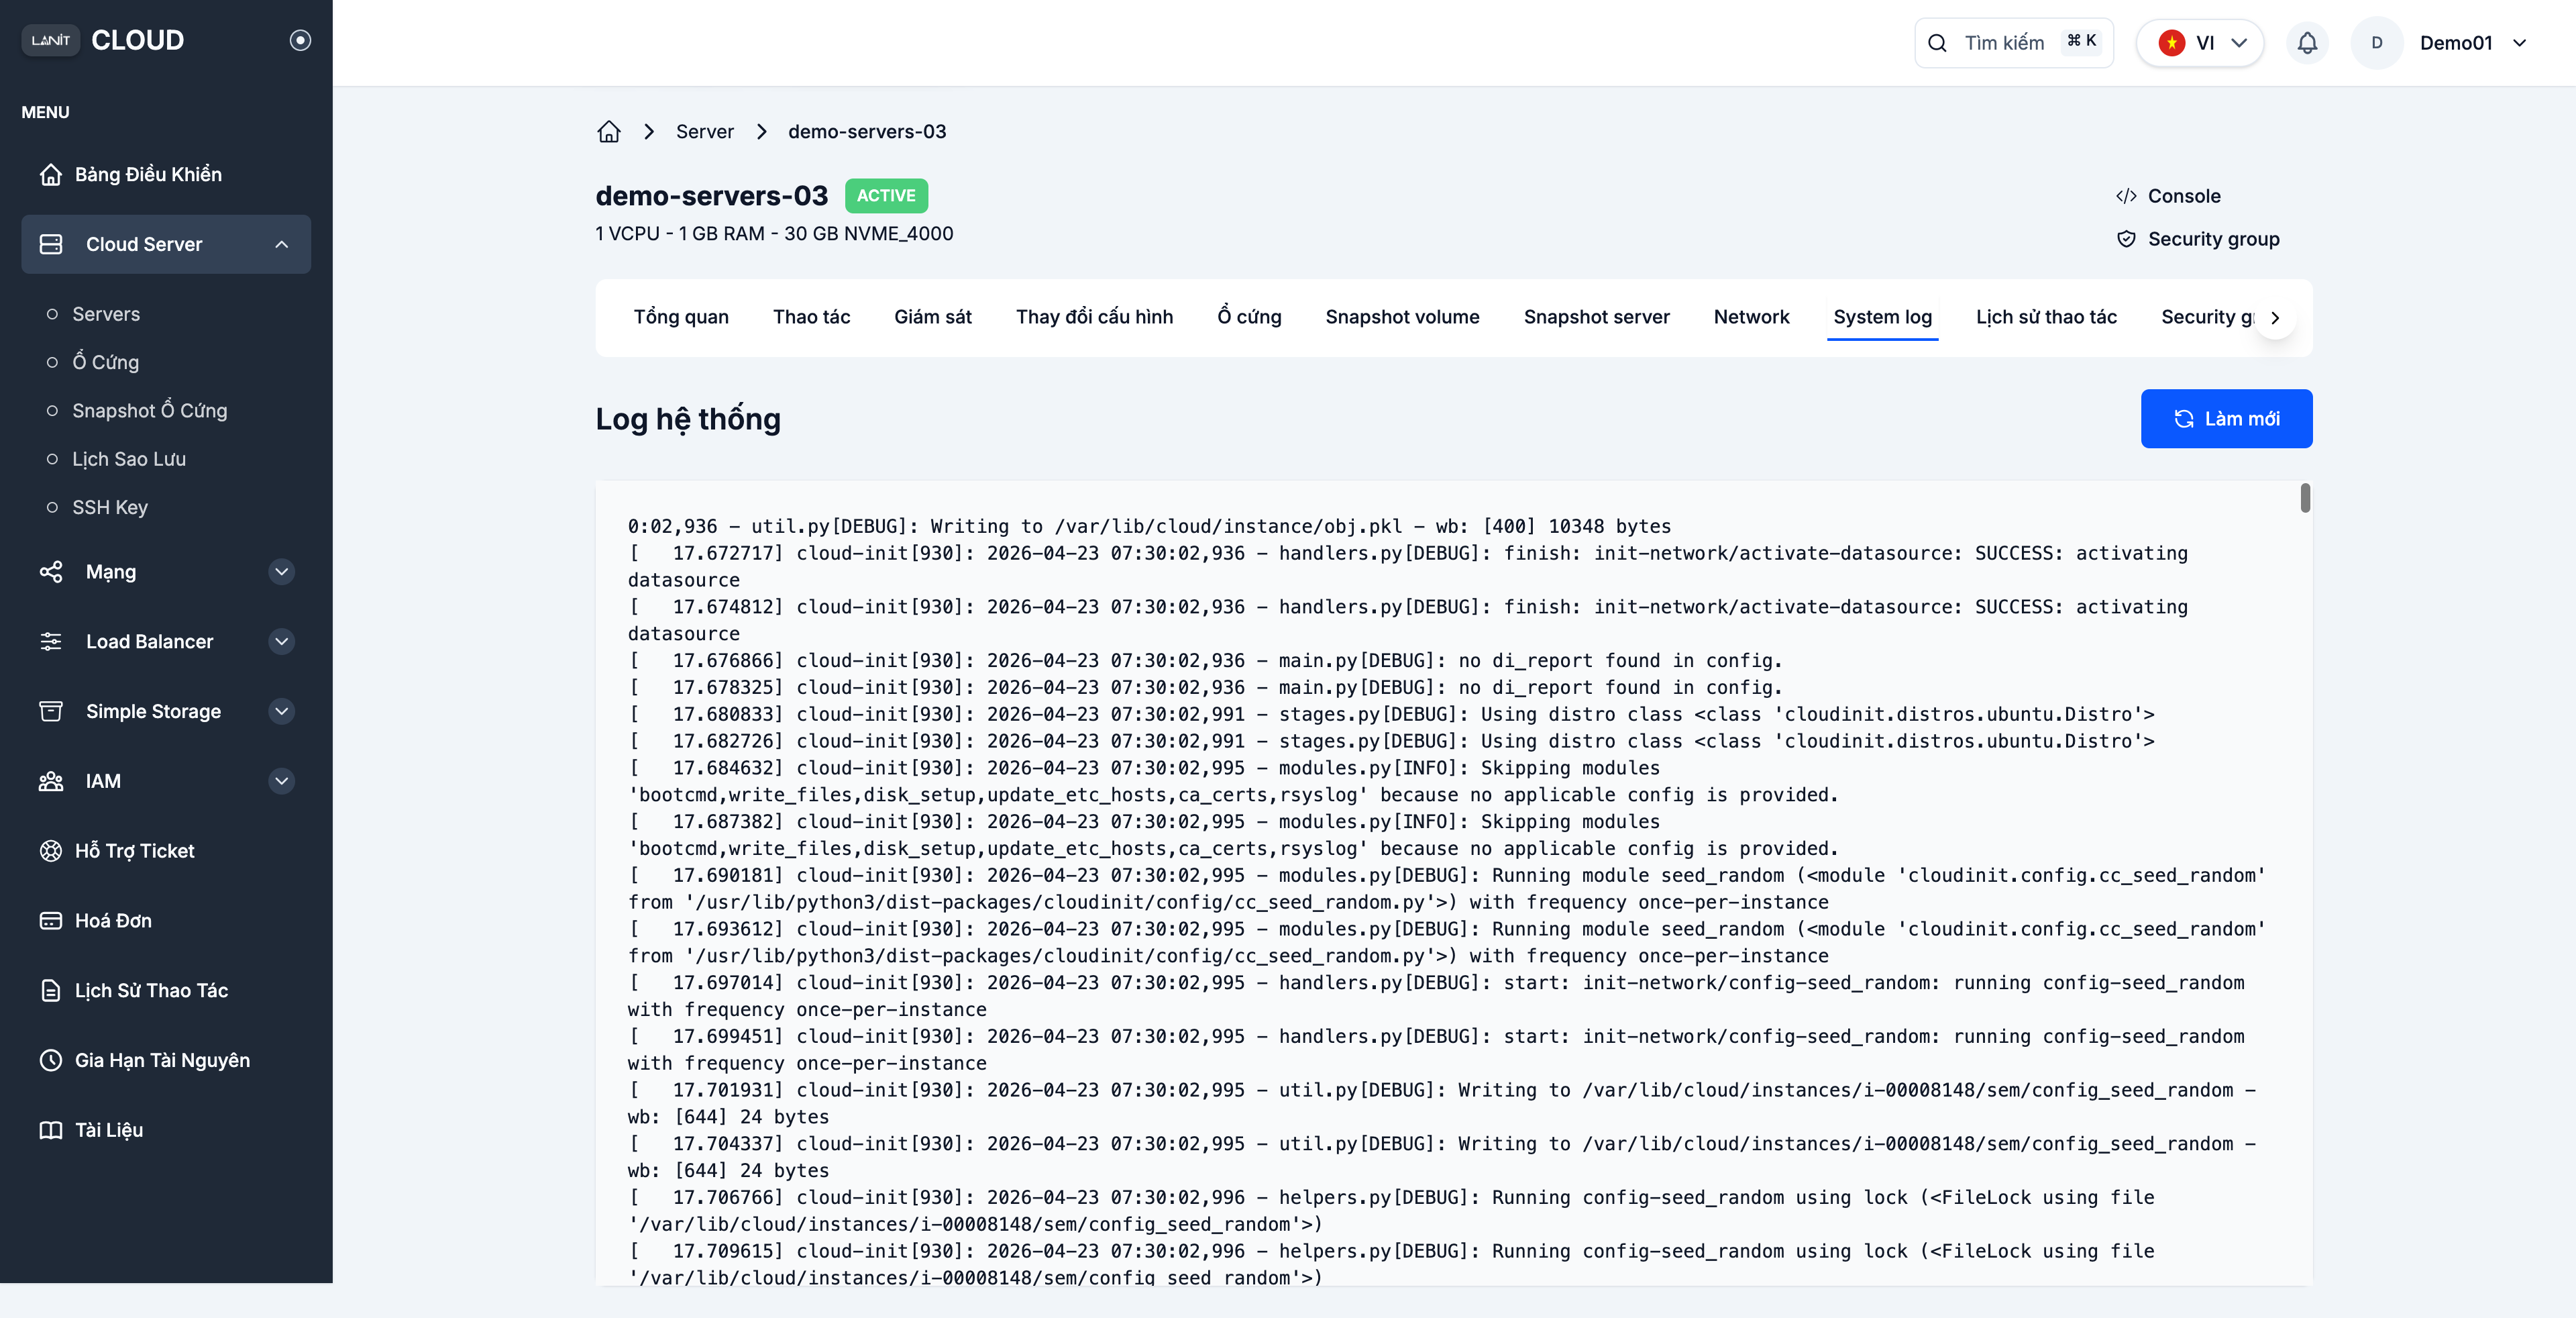
System log
The System log tab shows the VM's cloud-init / kernel log — useful when debugging boot issues or network-init failures.
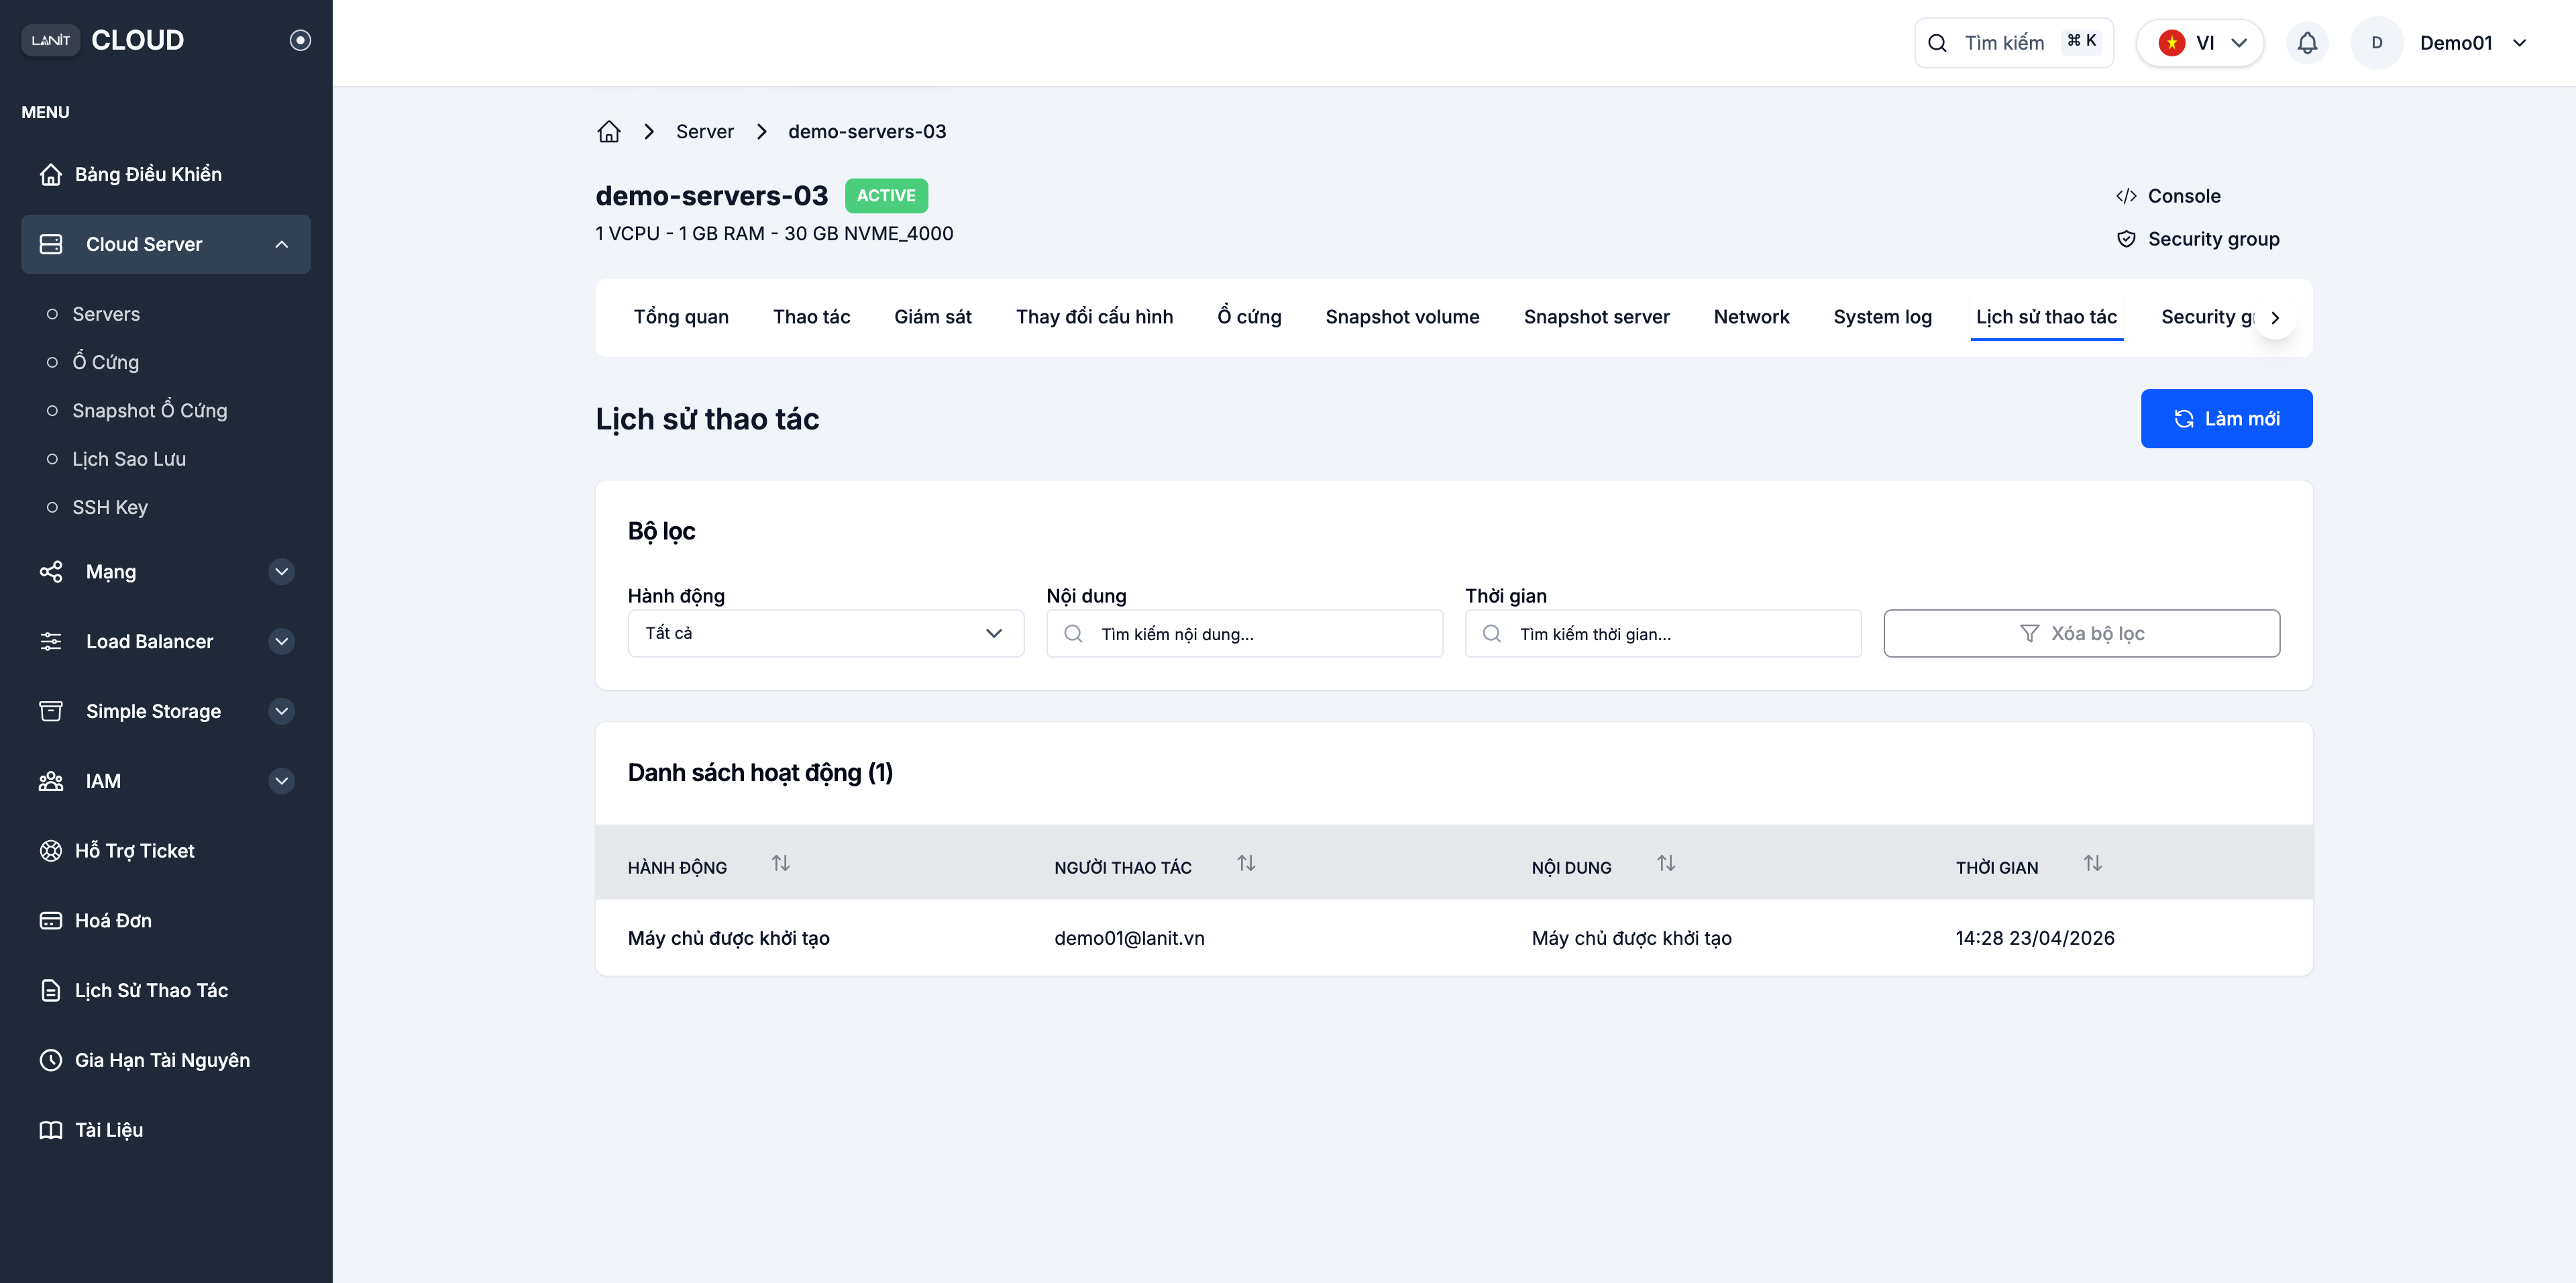
Lịch sử thao tác (Activity log)
The Lịch sử thao tác tab records every action on this VM (create, reboot, resize…) — for audit and incident triage.
Next steps
- Resize the VM when resources run low.
- Take a Snapshot before major upgrades to have a rollback point.